Comment peut-on vous aider ?

Monitoring d'installations via ENIRIS
Bienvenue dans notre série de tutoriels dédiée à ENIRIS SmartgridX, la plateforme de monitoring énergétique proposée par ENERSOL.
Grâce à ces vidéos, vous découvrirez pas à pas comment créer votre compte, naviguer efficacement dans le portail SmartgridX et accéder aux données essentielles de vos installations énergétiques.
Ces tutoriels vous guideront pour tirer le meilleur parti de votre solution de supervision énergétique.
Pour toute question relative à l'utilisation de l'outil de monitoring, veuillez nous contacter par mail à sav@enersol.be
Tutoriels d'utilisation de la plateforme de monitoring ENIRIS SmartgridX
Voir tout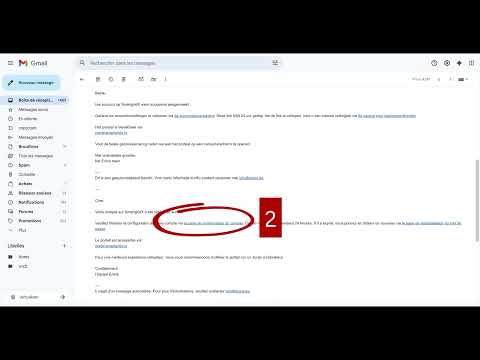
Webinaire: Nouvelle plateforme de supervision et de pilotage énergétique
Voir tout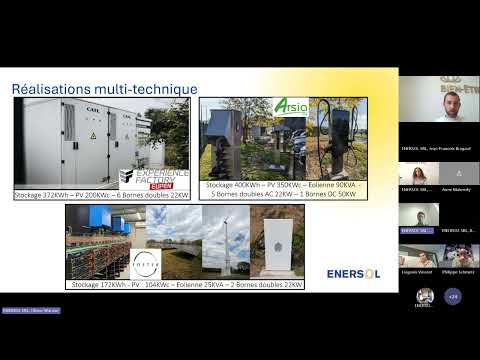
Comment accéder au portail de monitoring ENIRIS Smartgrid X ?
Si vous avez déjà créé un compte, rendez-vous sur portal.smartgridx.io.
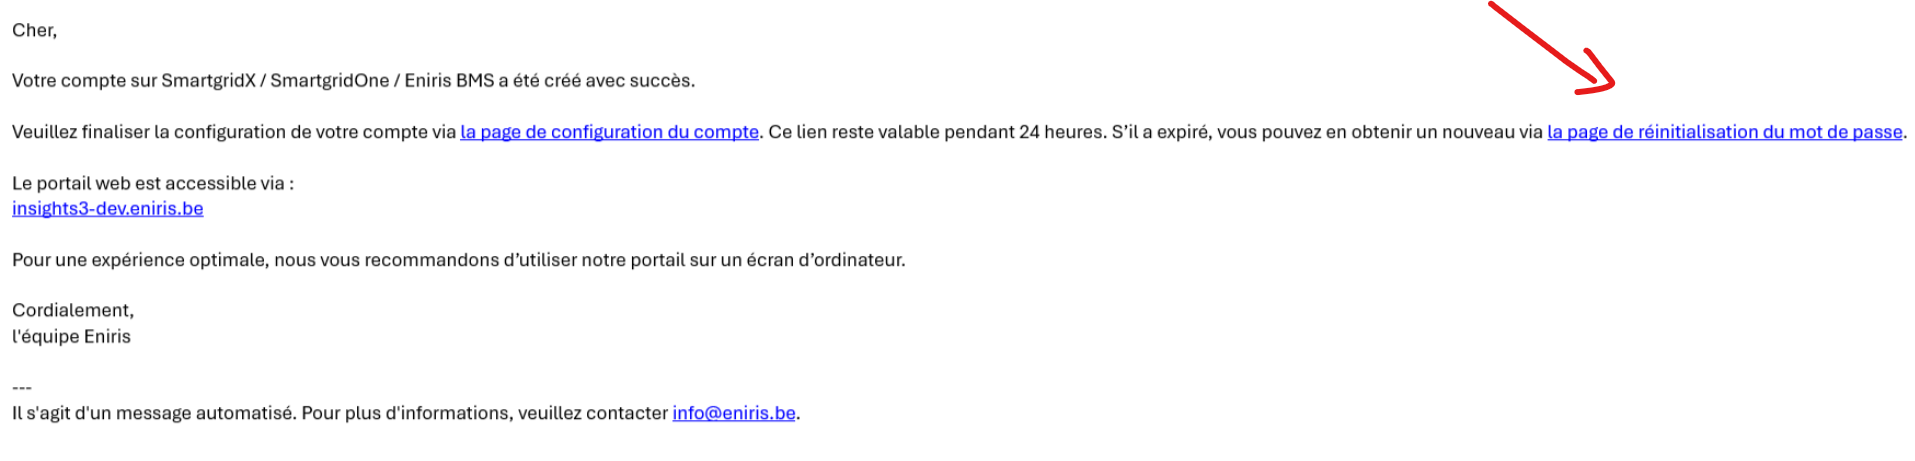
Si vous n'avez pas encore de compte, vous devriez avoir reçu un email de création de compte avec pour objet " SmartgridX - Login credentials - Logingegevens - Données de connexion - Anmeldedaten" vous permettant de créer un compte.
Consultez également la vidéo d'explications https://enersol.dphi.be/slides/slide/acceder-a-mon-compte-smartgrid-x-150.
Comment créer un compte ENIRIS pour d'autres utilisateurs?
Pour créer un nouveau compte (par exemple pour vos collaborateurs), prenez contact avec ENERSOL par mail via notre adresse sav@enersol.be. Nous nous chargerons de la création du compte et de la configuration des droits d'accès.
Comment est calculée la "production prévue"?
Implantation
Puissance et énergie théorique
Onduleurs et installations
La puissance solaire théoriquement atteignable dépend de la quantité d’irradiation dans la zone géographique des panneaux.
La puissance solaire idéale théorique d’un actif de production (une installation complète ou un onduleur) est calculée de l’une des manières suivantes :
- Configuration Simple : Dans ce cas, seul un kWp est renseigné. Cela correspond à une configuration de panneaux horizontaux simple.
- Par implantation: Une ou plusieurs implantations de panneaux sont définies pour un actif, chacune avec son propre kWp, azimut et inclinaison. La puissance idéale théorique de l’actif est la somme des puissances idéales théoriques des implantations.
- Basée sur les dispositifs sous-jacents : La puissance idéale théorique de l’actif est la somme des puissances idéales théoriques des dispositifs sous-jacents.
Dans tous les cas, si l’actif est un onduleur, une puissance de sortie maximale peut être définie. Si la puissance idéale dépasse cette valeur, elle est réduite à la puissance maximale.
Implantation
Une implantation de panneaux est un groupe de panneaux ayant la même orientation (azimut et inclinaison) et un nombre donné de kWp. La puissance idéale théorique d’une implantation est calculée en multipliant l’irradiation dans le plan des panneaux (en W/m²) par le nombre de kWp des panneaux.
L’irradiation dans le plan d’un panneau est approximée en additionnant l’irradiation diffuse et l’irradiation directe, cette dernière étant multipliée par un facteur compris entre 0 et 1, selon l’angle d’incidence du soleil sur le panneau. Ce facteur correspond au cosinus de l’angle entre la normale au panneau et la direction du soleil.
Azimut et inclinaison
L’azimut indique de combien de degrés les surfaces des panneaux dévient de l’orientation nord exacte.
- Pour une déviation vers l’est, entrez une valeur positive (ex. : 20).
- Pour une déviation vers l’ouest, entrez une valeur négative (ex. : -20).
Comment est calculé le ratio de performance?
Implantation
Le ratio de performance (PR) est un nombre exprimé en pourcentage qui représente le rapport entre la puissance solaire mesurée et la puissance théoriquement atteignable, toutes deux calculées sur le même intervalle de temps.
Dans le tableau de la page d’aperçu du portail SmartgridX, le PR est calculé sur la période de 2 jours, il y a 3 jours, tandis que dans les graphiques, il est calculé sur l’intervalle sélectionné.
Puissance et énergie théorique
Onduleurs et installations
La puissance solaire théoriquement atteignable dépend de la quantité d’irradiation dans la zone géographique des panneaux.
La puissance solaire idéale théorique d’un actif de production (une installation complète ou un onduleur) est calculée de l’une des manières suivantes :
- Configuration Simple : Dans ce cas, seul un kWp est renseigné. Cela correspond à une configuration de panneaux horizontaux simple.
- Par implantation: Une ou plusieurs implantations de panneaux sont définies pour un actif, chacune avec son propre kWp, azimut et inclinaison. La puissance idéale théorique de l’actif est la somme des puissances idéales théoriques des implantations.
- Basée sur les dispositifs sous-jacents : La puissance idéale théorique de l’actif est la somme des puissances idéales théoriques des dispositifs sous-jacents.
Dans tous les cas, si l’actif est un onduleur, une puissance de sortie maximale peut être définie. Si la puissance idéale dépasse cette valeur, elle est réduite à la puissance maximale.
Implantation
Une implantation de panneaux est un groupe de panneaux ayant la même orientation (azimut et inclinaison) et un nombre donné de kWp. La puissance idéale théorique d’une implantation est calculée en multipliant l’irradiation dans le plan des panneaux (en W/m²) par le nombre de kWp des panneaux.
L’irradiation dans le plan d’un panneau est approximée en additionnant l’irradiation diffuse et l’irradiation directe, cette dernière étant multipliée par un facteur compris entre 0 et 1, selon l’angle d’incidence du soleil sur le panneau. Ce facteur correspond au cosinus de l’angle entre la normale au panneau et la direction du soleil.
Azimut et inclinaison
L’azimut indique de combien de degrés les surfaces des panneaux dévient de l’orientation nord exacte.
- Pour une déviation vers l’est, entrez une valeur positive (ex. : 20).
- Pour une déviation vers l’ouest, entrez une valeur négative (ex. : -20).
Formules
- Yf=kWh/kWp sur un interval de temps
- Yr=rendement de référence sur le même interval
- Si l’interval est d’un an, on parle de rendement final.
- PR=Yf/Yr×100
Exemple :
- Production actuelle : 15 kWh
- Puissance installée : 200 kWp
- Irradiation actuelle : 101 W/m²
Yf=15/200=0,075
Yr=101/1000=0,101
PR=74,2%
Alertes
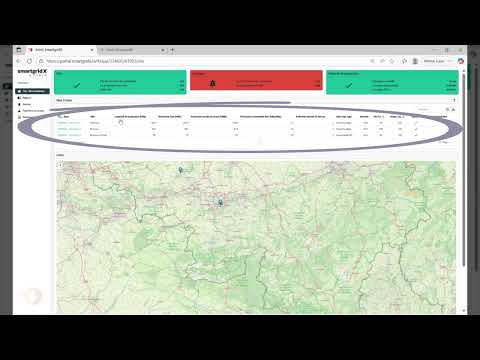
Notre portail vous alerte si le PR descend en dessous de 50 %. Les installations avec un PR faible peuvent être trouvées en cliquant sur la tuile d’alarme ou en triant par PR.
Remarque : Pour un calcul correct du PR, vous devez indiquer combien de kWp de panneaux sont connectés à une installation (ou un onduleur). Cela se fait via la page des paramètres de l’installation ou de l’onduleur concerné et est réalisé par ENERSOL.
Comment puis-je créer un rapport de productible?
Rendez-vous sur SmartgridX dans l'onglet "Rapports". Sélectionnez la période souhaitée et le site concerné, et demandez la génération du rapport, soit par mail, soit en téléchargement direct.
Comment est calculée la disponibilité?
La disponibilité (uptime) est le pourcentage de temps pendant lequel l’installation est active durant les moments où elle doit fonctionner (c’est-à-dire lorsqu’il y a suffisamment de soleil / qu’un certain seuil est dépassé). Par corollaire, la disponibilité indique également si toutes les données de production ont bien été transmises par l'onduleur vers le monitoring.
Le temps de disponibilité est calculé sur une période de 2 jours il y a 3 jours, dans la page d’aperçu des installations, des onduleurs et des chaînes (strings).
Dans les graphiques, le temps de disponibilité est calculé sur l’intervalle sélectionné.
Formule :
Uptime=(Tutile−Tdown)/Tutile×100
- Tutile = période pendant laquelle l’irradiation est supérieure au seuil minimal d’irradiance (MIT), exprimée en heures.
- Tdown = période pendant Tutile durant laquelle l’installation ne produit pas, exprimée en heures.
Le MIT (Minimum Irradiance Threshold) est généralement compris entre 50 et 70 W/m².
Est-il possible de calculer l'auto-consommation de mon site?
L'auto-consommation peut être calculée à condition qu'un compteur soit installé au point de raccordement.
Pour en savoir plus, contactez nous via sav@enersol.be
Je souhaite limiter l'injection en cas de prix d'énergie négatifs, comment faire?
Si vous n'en disposez pas encore, l'installation d'un controleur de type "SmartGridOne" et d'un éventuel compteur d'énergie est une solution simple et efficace pour piloter l'énergie de votre site, ce qui inclus le bridage des onduleurs en cas d'injection à prix négatifs.
Le controleur SmartgridOne permet d'optimiser toute la gestion énergétique de votre site, comme par exemple un parc de batteries ou des bornes de recharge pour véhicules électriques.
Puis-je encore accéder aux données sur l'ancienne plateforme?
L'ancienne plateforme restera encore active pendant quelques semaines avec les données historiques. Son accès sera retiré avant fin 2025. Les données historiques ont été migrées vers ENIRIS afin de les rendre disponibles sur la nouvelle plateforme.
Mon lien de création de compte est expiré, comment en obtenir un nouveau?
Le lien de création de compte envoyé par Eniris, s'il est expiré, vous permet de regénérer un nouveau mail via le lient "page de réinitiatisation du mot de passe", vous permettant d'être entièrement autonome.